Data and Information Literacy
4.2
Focus Tasks
Collect and Sort
There are two main challenges within this element. Firstly, we need to make sure the pupils understand that data can be represented in different ways. Secondly, we have to learn how to gather and sort data.
Compare groups of objects / Sort objects into groups
These two skills are clearly very similar. Start by showing objects divided into two groups and ask the pupils what criterion you used. Start with something simple such as colour (group of red objects, group of blue objects). Repeat with a range of other criterion, for example:
- Large / Small
- Fruit / Vegetables
- Cars / Trains
- Sea Creatures / Land animals
- Food / Drink
Once you are satisfied that your pupils have understood how to identify how items are grouped, ask them to group items themselves. What objects they group is up to you, there are endless options but here are a few ideas:
- Items collected from the woods or school garden. Divide into plants / rocks.
- Shell and stones collected from a trip to the beach. Divide into shells / stones or by large / small.
- Leaves collected from the yard. Divide into large / small or green / brown.
- Pictures of the pupils in your class. Can be divided by girl / boy or by hair colour.

Record information on a pictogram
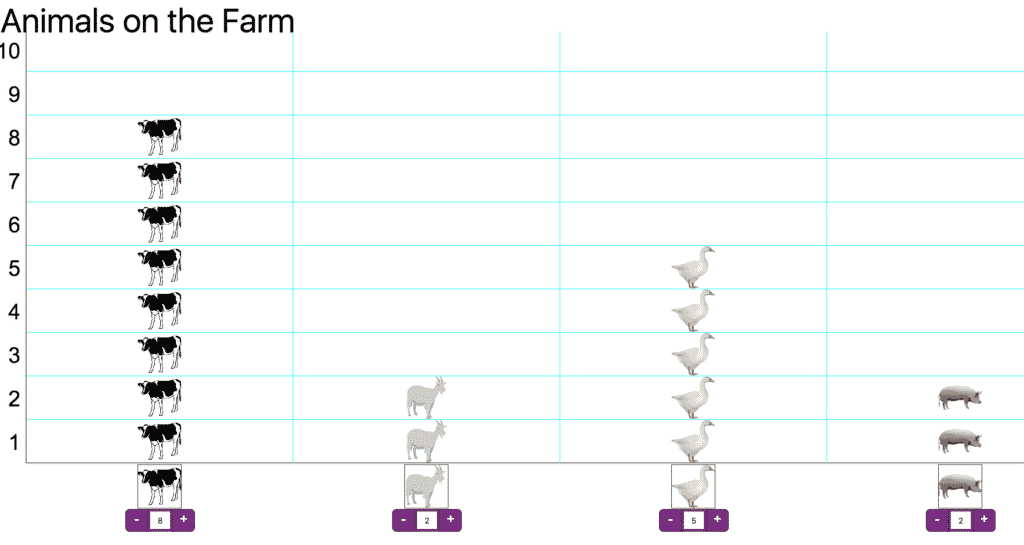
A pictogram is a child's first step into graphs. It's very likely that you will have been using pictograms in your class for some time and therefore will have your own excellent ideas and resources. Just in case you don't, here is a quick explanation.
Log in to a simple pictogram software such as 2Count (Purple Mash) or JIT (J2e in Hwb). Pupils should create a pictogram using data they've collected in class, for example:
- Pupils' favourite fruit, mini beast, colour etc.
- How pupils come to school (car, walk, bus, bike).
- What they found on a mini-beast hunt.
Pupils will need to find a picture to go with each bar and set it to the correct number. Differentiate by asking the more able pupils to type a one word title or even the names of the groups (Possible on JIT, not on 2Count).
Enhanced Provision
Sorting Corner
Every week, put a different collection of items in a 'Sorting Corner' or 'Sorting Box'. You can provide headings for pupils to sort them into (e.g. blue/green or fish/bird) or let your pupils choose their own criteria. Remind pupils to take a photo once they've sorted them.
