Menu

Data and Information Literacy

4.2

Intro

'Data and Information Literacy' is an interesting element. It concentrates on collecting, sorting and presenting data.

For KS2 teachers, this element can be a struggle as they deal with databases and spreadsheets, but for you in the Foundation Phase you're likely to find that you're already teaching most of these skills through your Numeracy work.


Framework

4.1 - Data and Information Literacy

  • collect and organise data into groups, e.g. gather data by voting or sorting and represent in pictures, objects or drawings
  • extract information from simple tables and graphs, e.g. answer questions on table graph
  • record data collected in a variety of suitable formats, e.g. lists, tables, block graphs and pictograms.

Skill by Skill

  • Find information from a given source, using it to answer simple questions.
  • Gather and record information on a simple graphing program (e.g. pictogram, block chart, tally chart).
  • Identify types of fields in a database.
  • Enter information into a record of a simplified database program with some assistance.

(EAS ICT Skills Framework)

Vocabulary

group     sort     collect     pictogram     tally     block     database     field

Activity 1

Survey Time

block chart

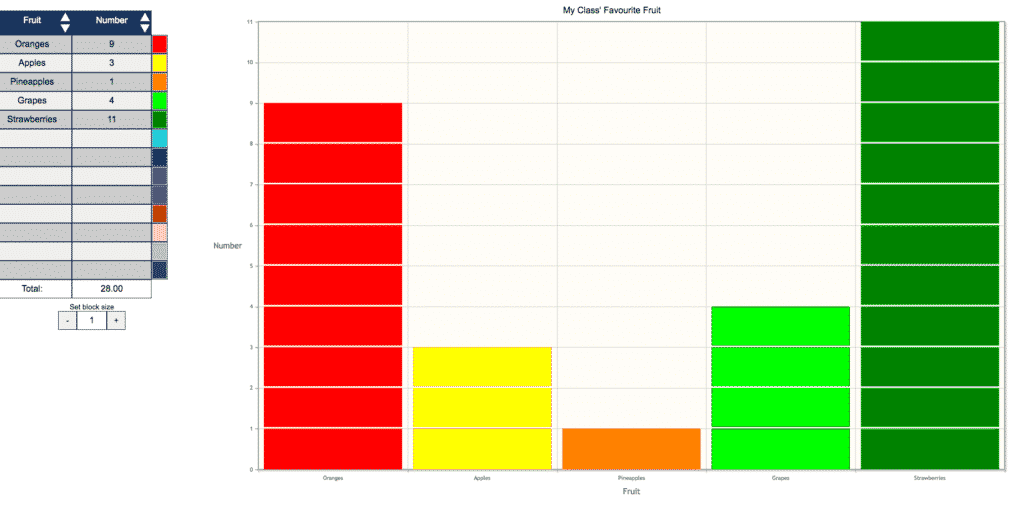
This activity is very similar in Year 2 to the one in Year 1. Pupils are required to collect information through a tally chart, then create a block graph and pictogram with the data collected.

Pupils should create a tally chart (on paper) and collect answers to a question such as:

  • Pupils' favourite fruit, mini beast, colour etc.
  • How pupils come to school (car, walk, bus, bike).
  • What they found on a mini-beast hunt.

Next, log in to a simple pictogram or block chart software such as 2Count / 2Graph (Purple Mash) or JIT (J2e in Hwb). Pupils should create a pictogram using data they've collected in tally charts in class.

For the pictograms, pupils will need to find a picture to go with each bar and set it to the correct number. Whether they are creating a pictogram or a block chart, pupils should enter the field names and graph title themselves.

Success Criteria

  • I can record information in a tally chart.
  • I can create a pictogram and a block chart to show my data.

Other Framework Elements

2.3 - Storing and Sharing

Pupils will need to save their work and select a good file name.

3.2 - Creating

This task involves creating as there is a combination of images and text.

3.3 - Evaluating and Improving

Your usual peer-assessment and/or self-assessing.

Vocabulary

tally chart     pictogram     block chart     fields     title

Variation Ideas

Clearly the survey can be on any topic, but keep the main aspects of the activity as they are, so that pupils create tally charts, pictograms and block charts.

Activity 2

Reading a Graph

This is a skill that you have been teaching in your Numeracy tasks for years and should therefore provide you with no difficulty. Present your pupils with a simple graph showing data such as:

  • Favourite pets of 20 children.
  • The number of birds of each species spotted on a bird watch.
  • The colours of cars in the school parking lot.

Pupils will need to answer questions such as:

  • What pet was most popular?
  • How many white cars are there in the parking lot?
  • Did they see more blackbirds or seagulls?

Success Criteria

  • I can find data in a graph.

Other Framework Elements

None

Vocabulary

tally chart     pictogram     block chart     fields

Variation Ideas

Repeat the activity often with different types of tables and graphs and with different data.

Enhanced Provision

Personal Surveys

Let them create their own surveys during their independent learning time. They could use the graphing software they used during the focus task, or you could have some blank tally charts and pictograms printed and laminated for them to create their own surveys.