Data and Information Literacy
4.2
Focus Tasks
Sorting and Creating Graphs
There are two main challenges within this element. Firstly, we need to start sorting data according to more than one criterion. Secondly we need to create graphs using simple software.
Classify an object using more than one criterion.
Venn diagrams are the key here (or even a Carroll Diagram if you're feeling ambitious).
- Create a Venn diagram with two overlapping hula hoops. Gather a collection of objects, some green, some yellow and some a mix of both colours. Pupils arrange them correctly. As a challenge, add a few items which are not green nor yellow.
- Repeat the above activity with any criteria where there can be an overlap (e.g. large/small won't work as it's impossible for any object to be both whereas metal/wood could work as some objects include both materials.) You can even use numbers instead of objects (5 times table / 10 times table).
- This activity can also be done on paper or on a computer. There are plenty of Venn diagram activities available through Google or on Hwb.
Gather and record information on a simple graphing program (e.g. pictogram, block chart, tally chart).

Hopefully your pupils will have started working with pictograms and tally charts in Reception. They should continue to create them in Year 1, whilst also being introduced to block charts.
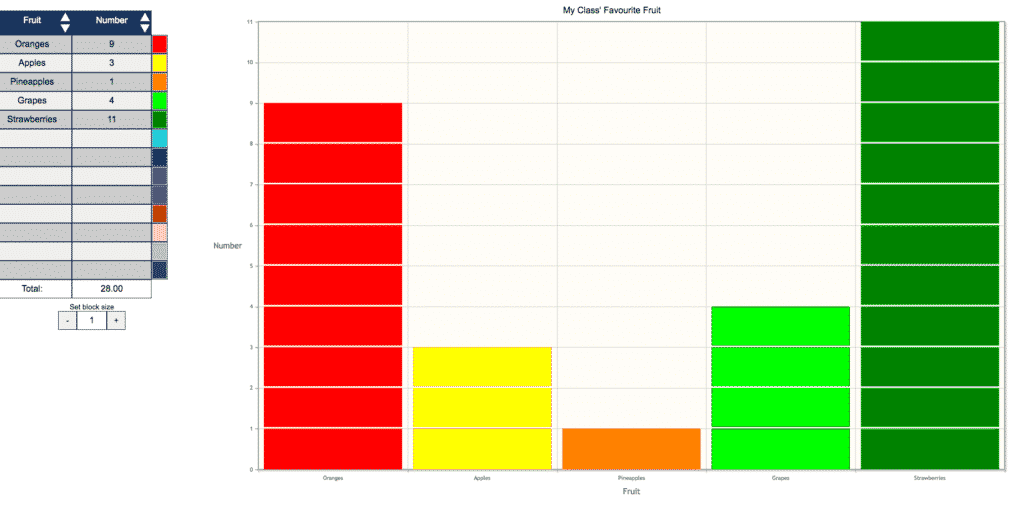
Log in to a simple pictogram or block chart software such as 2Count / 2Graph (Purple Mash) or JIT (J2e in Hwb). Pupils should create a pictogram using data they've collected in tally charts in class, for example:
- Pupils' favourite fruit, mini beast, colour etc.
- How pupils come to school (car, walk, bus, bike).
- What they found on a mini-beast hunt.
For the pictograms, pupils will need to find a picture to go with each bar and set it to the correct number. Whether they are creating a pictogram or a block chart, pupils should enter the field names themselves.
Enhanced Provision
Personal Surveys
Every week, put a different collection of items into a 'Sorting Corner' or 'Sorting Box". You can provide categories into which pupils sort these items (e.g. blue/green or fish/bird) or let your pupils choose their own criteria. Remind them to take a photo once they've sorted them as they wish.
Let them create their own surveys during their independent learning time. They could use the pictogram software they used during the focus task, or have some blank tally charts and pictograms printed and laminated for them to create their own surveys.
