Spreadsheets
4.2 - Data and Information Literacy
Ready to Subscribe?
Activity 1
Holiday Money

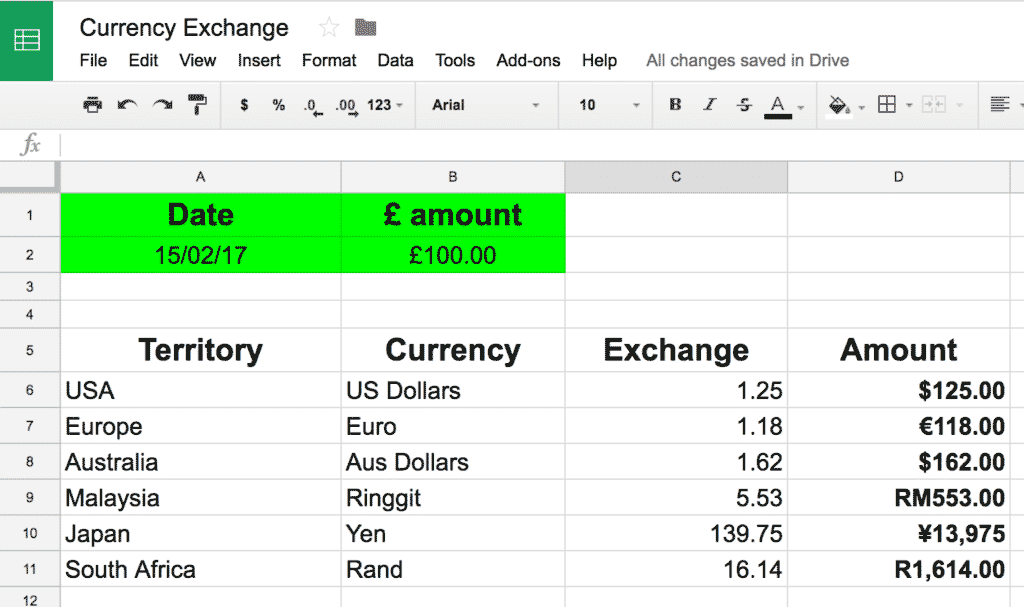
The pupils will be creating a spreadsheet for a Currency Exchange company, making it easy to convert pounds into other currencies. This activity can look daunting at first glance, but don't worry, a few simple formulas are all that's needed.
Prepare:
- Make a copy of our model sheet then do the activity yourself first, so that you will be familiar with what the pupils will be doing and also have a model to show them at the start of the activity.
Activity Tasks:
- Explain what a currency exchange business does and when you would use one.
- Show the pupils your model spreadsheet, highlighting the key formula (see link below) and the fact that changing the amount of pounds changes all the other currency amounts.
- Remind the pupils how to format the different cells to show date or currency. Also point out where the formula button is on the toolbar. They should know all this from their Year 4 activities.
- Ask the pupils to create their own version of the spreadsheet, using current exchange rates. (These can easily be found on the web with websites such as xe.com.) Allow them to round to two decimal points.
- Ask them how much they would receive in the various currencies for differing pound amounts. They should input these pound amounts into their spreadsheet to see the changes that occur.
Guide to Creating a Currency Exchange Spreadsheet
Activity 2
My Beating Heart
Pupils will have created bar graphs from their spreadsheets in the past. This activity moves on to line charts whilst also adding some multimedia aspects. It is a great activity to combine with a science unit that measures changes over time (in this example, your heart rate).
Prepare:
- First, practise the activity yourself so that you can create a model for you pupils and help them when needed.

Activity Tasks:
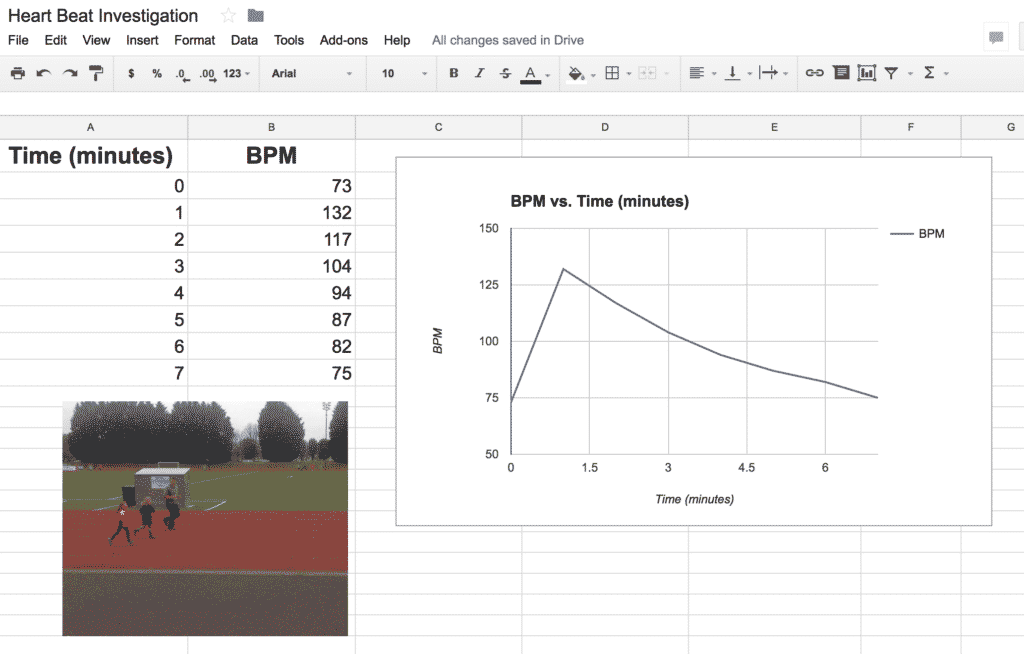
- Plan and conduct an experiment on the effect of exercise on heartbeat. Count your heart's beats per minute (count for 20 second and multiply by 3) before exercise, immediately after and then every 1 min until it returns to pre-exercise levels.
- Record the results in a simple table on your spreadsheet. One column should be for time elapsed, another for heart beat per minute.
- Highlight the two columns and use the 'Create graph' function to make a line chart.
- Ensure both axes are labelled correctly and the graph is given a title.
- Insert images to place by the table (preferably images they took during the investigation, or images of their planning work.)
Remember
- Spreadsheets aren't as complicated as people fear. Take this activity slowly and guide the pupils step by step and it will be easy - for them and for you!
