Spreadsheets
4.2 - Data and Information Literacy
Activity 1
Interrogate a Spreadsheet

This first activity is very simple and very quick. It's unlikely to take you a full lesson. Pupils will look at a spreadsheet you have created and answer simple questions from it.
Prepare:
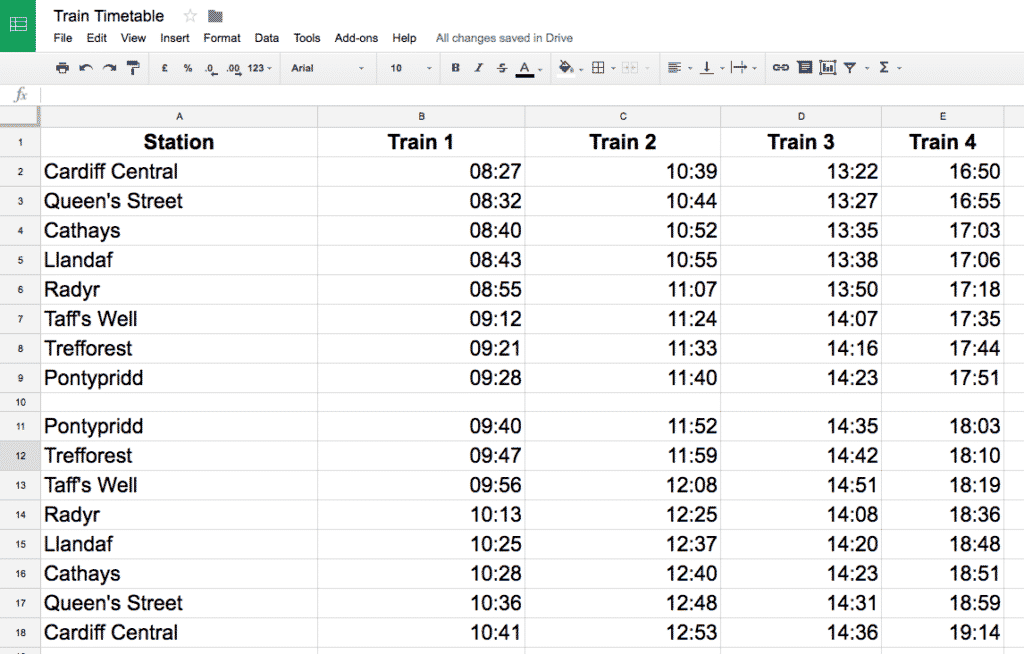
- Either take a copy of our timetable, or create a train timetable yourself as a spreadsheet using Excel or Google Sheets. The spreadsheet should be kept simple, similar to the example to the left.
- Write five or six questions which can be answered from looking at the spreadsheet (e.g. What time does the train depart Pontypridd? If I want to reach Cardiff Queen Street as close as possible to 1pm, what time should I catch my train from Merthyr? How long does the first train take to travel from Radyr to Cardiff Central?)
Activity Tasks:
- Show the pupils the spreadsheet. (It can be on the interactive whiteboard or printed out, but the best method is to allow them to open a copy on their computers so that they can get used to Excel or Google Sheets.)
- Ask a few example questions, helping them get familiar with the format of the timetable.
- Give them all the questions to be answered. You can differentiate by having questions involving additional maths for the more able pupils (e.g. "How long does the train take to travel from Radyr to Cardiff Central")
- Have pupils write questions to challenge each other.
Remember
- This is a very simple activity, similar to graph or table reading activities which they have done countless times in Maths lessons.
Activity 2
Let's Throw a Party
Having learnt what a spreadsheet is in Activity 1, pupils will now start adding their own data into a prepared spreadsheet and even use the formula button to create simple addition and multiplication formulas.
Prepare:
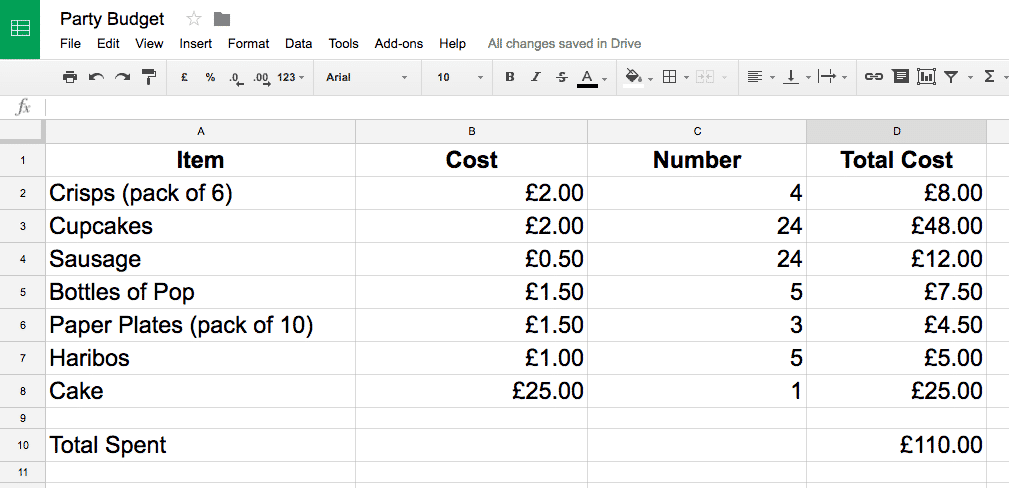
- Create a spreadsheet in Excel or Google Sheets (Or take a copy of ours!). The spreadsheet should contain a list of items which can be bought for a party, with a price for each item in the next column.
- Share the spreadsheet so that each pupil have their own copy.

Activity Tasks:
- Explain that they are going to plan a party for 30 people and that they have a budget of £100.
- Show the spreadsheet to the pupils, and explain how to open and save their own copy (or, if using Google Classroom, simply share a copy to each pupil.)
- Pupils will create a third column, writing down how many of each item to buy. They do not need to worry too much about cost just yet.
- Show them how to turn the fourth column into a totals column, by using the formula function on the first row to multiply cost per item with number of items. They can then copy that formula and paste it to the rest of the cells in the fourth column to repeat the calculation for all items.
- Next, they should create a formula adding the totals in the fourth column to find the final price of their party.
- If the price is significantly under or over £100, they should amend their order to bring the cost closer to their budget.
Adding & Multiplying in Google Sheets
Remember
- As an extension to this task, tell them that they've been given an additional £50 to spend. Ask them to amend their order to reach the new budget.
- Spreadsheets aren't half as complicated as people fear. Take this activity slowly and guide the pupils step by step and it will be easy (for them and for you!)
Activity 3
Independent Graphs
In Year 3, pupils were guided through the steps of making a simple bar chart from Excel or Google Sheets. In Year 4, there are no new graph making skills to learn, but pupils should become confident in quickly creating a table and bar graph with spreadsheets. Whilst you can easily make graphs in Purple Mash or J2E as well, this activity expressly involves spreadsheets so stick to Excel or Google Sheets.

Prepare:
- Conduct a scientific experiment or a maths survey that will collate data as a tally (which they will use to create a bar chart in this activity).
Activity Tasks
- Pupils create a blank spreadsheet using Excel or Google Sheets.
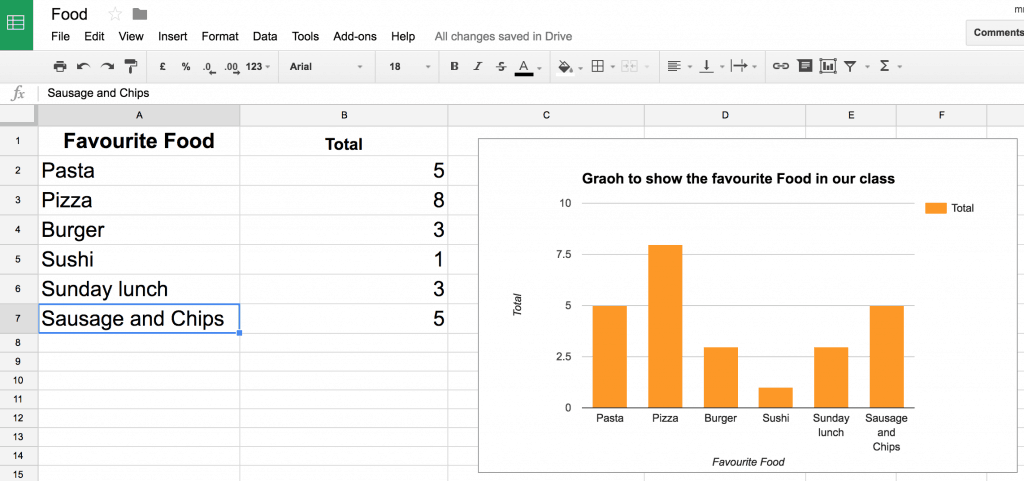
- Remind them that they need to create two columns, one with the options and one with the tally.
- Enter all the data from their tally charts into the spreadsheet.
- Highlight the two columns and use the graph function to make a bar chart.
- Ensure both axes are labelled correctly and the graph is given a title.
Simple Charts in Google Slides
Remember
- This is a very similar activity to the one in Year 3. The intention is to develop their confidence in creating such tables and graphs quickly and without much assistance.
- Whilst it's important to teach pupils to be selective about printing, a completed bar graph is well worth printing!
