Spreadsheets
4.2 - Data and Information Literacy
Activity 1
6 Nations Trends

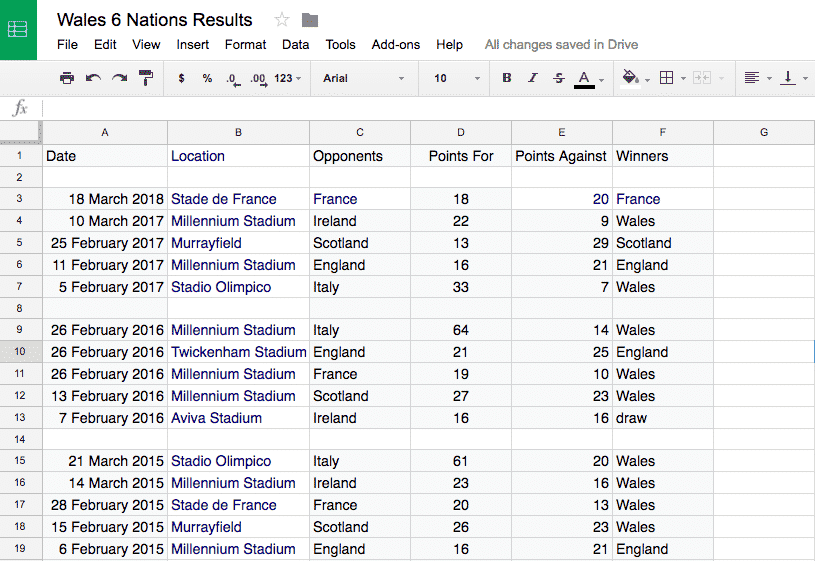
This first activity requires that your pupils look at a spreadsheet and spot trends and patterns. They will also learn how to use Conditional Formatting to highlight cells if Wales have won a match.
Prepare:
- Share a spreadsheet (Google Sheet, Excel, Numbers) with your pupils that has every result for Wales' Six Nations matches over the past few years. (Click on the button below to steal our spreadsheet!)
Activity Tasks:
- Ask pupils to open the spreadsheet on their devices. Ask them what the sheet shows (Wales' Six Nations results).
- Pupils should answer some beginner questions on the data. (In which years did Wales beat everybody? In which year(s) did they win the least amount of games? Which team have Wales beaten most/least often?)
- In pairs, pupils should look for any patterns or trends. They can present these in a Presentation (Slides, PowerPoint, Keynote). Here are some they may find:
- The teams we play at home one year, we play away the next.
- Wales have not lost to Italy during this period.
- Wales have not won more than 5 games in a row, nor lost more than 5 games in a row.
- Wales win 75% of their home games, but only a little over 50% of away games.
- Only one game has been drawn during this period.
- Wales have won 75% of their closing games, but less than 50% of their openers.
- Explain to the pupils that, in order to make the data easier to read, we are going to make the sheet automatically highlight games that Wales have won.
- Highlight column F (winner's name) and right click.
- Select 'Conditional Formatting'
- Change the settings so that if the text contains 'Wales' the cell is filled green.
- Repeat to create a second conditional formatting setting so that if the text does not contain the word Wales, it should turn red.
Remember
- The exact steps for Conditional Formatting vary according to whether you're using Google Sheets, Excel or Numbers. Just do a Google search on "Conditional Formatting in Sheets/Excel/Keynote" to find the correct steps for you.
Activity 2
Rugby Crowds
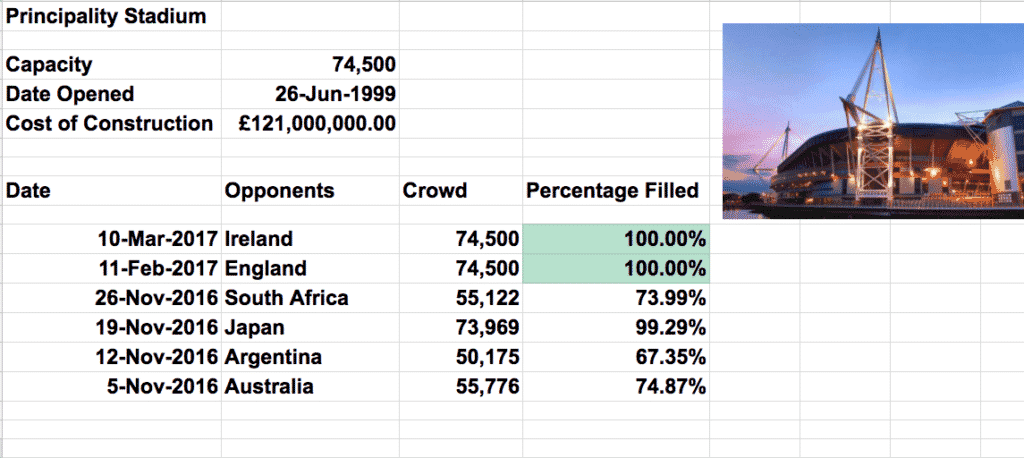
This spreadsheet activity lists the crowd size for recent Welsh home rugby internationals. Pupils will use formatting for currency, date and percentage cells, create a formula that works out a percentage and use conditional formatting to turn some cells green.
Prepare:
- Practise the activity yourself first to ensure you can help the pupils when needed and to have a model to show them.

Activity Tasks:
- Show your pupils a spreadsheet such as the one pictured above, (but with only the headings and opponents list filled.) They should start a new spreadsheet and copy those headings and opponents list.
- Explain that a spreadsheet needs to know what kind of data is in each cell. It can work out the difference between text and numbers, but won't automatically know if your numbers are dates, currencies, percentages or just plain numbers.
- Show them how to use the format option in the toolbar to tell the spreadsheet what type of data a cell contains.
- Pupils should search the web for the basic information on the stadium, the dates and crowd sizes for each match (changing the cell formats where needed) and for an image to insert.
- Discuss how you would work out a percentage. (Divide the crowd size by capacity, multiply by a hundred).
- Pupils create a formula for the final column (percentage filled). Explain that setting the cell to the Percentage format does the multiplying automatically, so our formula only has to divide.
- Finally, use Conditional Formatting (see Activity 1) to colour any sold out crowd green.
Remember
- Spreadsheets aren't half as complicated as people fear. Take this activity slowly and guide the pupils step-by-step and it will be easy (for them and for you!)
